Zachary A. Ingalls, ME | Director, Field Operations Littleton, Colorado, USA
Mathew Martonovich, MS, PE | President, Engineering Operations Littleton, Colorado, USA
Carson S. Ogden, BA | Director, UAS/GIS Operations Littleton, Colorado, USA
Incident Scene Documentation and Time Management Using the FARO® FocusS 350 Versus Conventional Measurement Techniques
Abstract
Incident scene documentation presents a challenge to the responding police agency and forensic investigator alike. The police agency investigating an incident may have the luxury of closing a portion or entire section of roadway while conducting an at-scene investigation. However, the investigating authorities must balance proper scene documentation with timely clearing of the roadway to allow for normal traffic operations, all while maintaining safety for officers, first-responders and recovery operations.
The forensic investigator may receive immediate or delayed notification of an incident necessitating a scene visit and documentation. If responding soon after the incident, the forensic investigator must balance the need for thorough documentation while not encroaching upon or interfering with an active police investigation. The forensic investigator’s participation may be delayed until after the completion of the at-scene police investigation. Under these conditions, the forensic investigator must consider proper and thorough documentation, traffic safety and time management.
This paper provides the field investigator with a comparison between the quality of data obtained, the on-scene time to gather evidence, and the time to process the data into a completed scene diagram while documenting a staged collision event at an intersection between a motor vehicle and bicycle. The engineers of OEC Forensics utilized three common methods of scene documentation for this comparison; digital wheel with 200-foot tape, total station survey, and a high-definition survey (HDS) scan using the FARO® FocusS 350 Laser Scanner.
Staged Collision Scenario
OEC Forensics obtained permission to utilize a section of roadway within a development under construction. A T-intersection was selected having a roadway geometry consisting of both horizontal and vertical curvature that could affect the quality and time necessary to document the scene with the three methods selected. The basic scenario follows:
- A passenger vehicle traveling eastbound impacts a southbound bicycle emerging from a stop-controlled T-intersecting roadway.
- The passenger vehicle driver applies full locked-wheel ABS braking to final rest.
- The bicycle rider applies rear-wheel-only braking to impact.
- The passenger vehicle, bicycle, bicycle rider’s shoe, bicycle rider’s helmet and blood from the rider remained at their respective final rest locations during documentation.
- Total station and wheel measurements sufficient to provide roadway geometry and location of evidence.
- Incident scene captured using only three FARO FocusS 350 overlapping HDS scans to capture roadway geometry and evidence.
- Measurements taken to facilitate opening the roadway to traffic.
The photographs of Fig. 1 through Fig. 4 depict the staged collision scene and impact evidence. The roadway access to the incident location was blocked (simulating a police closure) while measurements were made, and to ensure safety of the personnel during documentation.

Fig. 1: Eastbound view along approach of vehicle.

Fig. 2: Southbound view along approach of bicycle.

Fig. 3: Skidding evidence and debris from bicycle.

Fig. 4: Rest location of bicycle and rider evidence.
Procedures
To ensure equitable and similar conditions for timing the documentation processes, time started when the required measurement equipment was removed from the vehicle and continued until placed back inside the vehicle following the completion of the documentation tasks. The scan using the FARO FocusS 350 was completed first, followed by the total station, and finally the digital wheel while the vehicles and evidence remained at their documented final rest positions
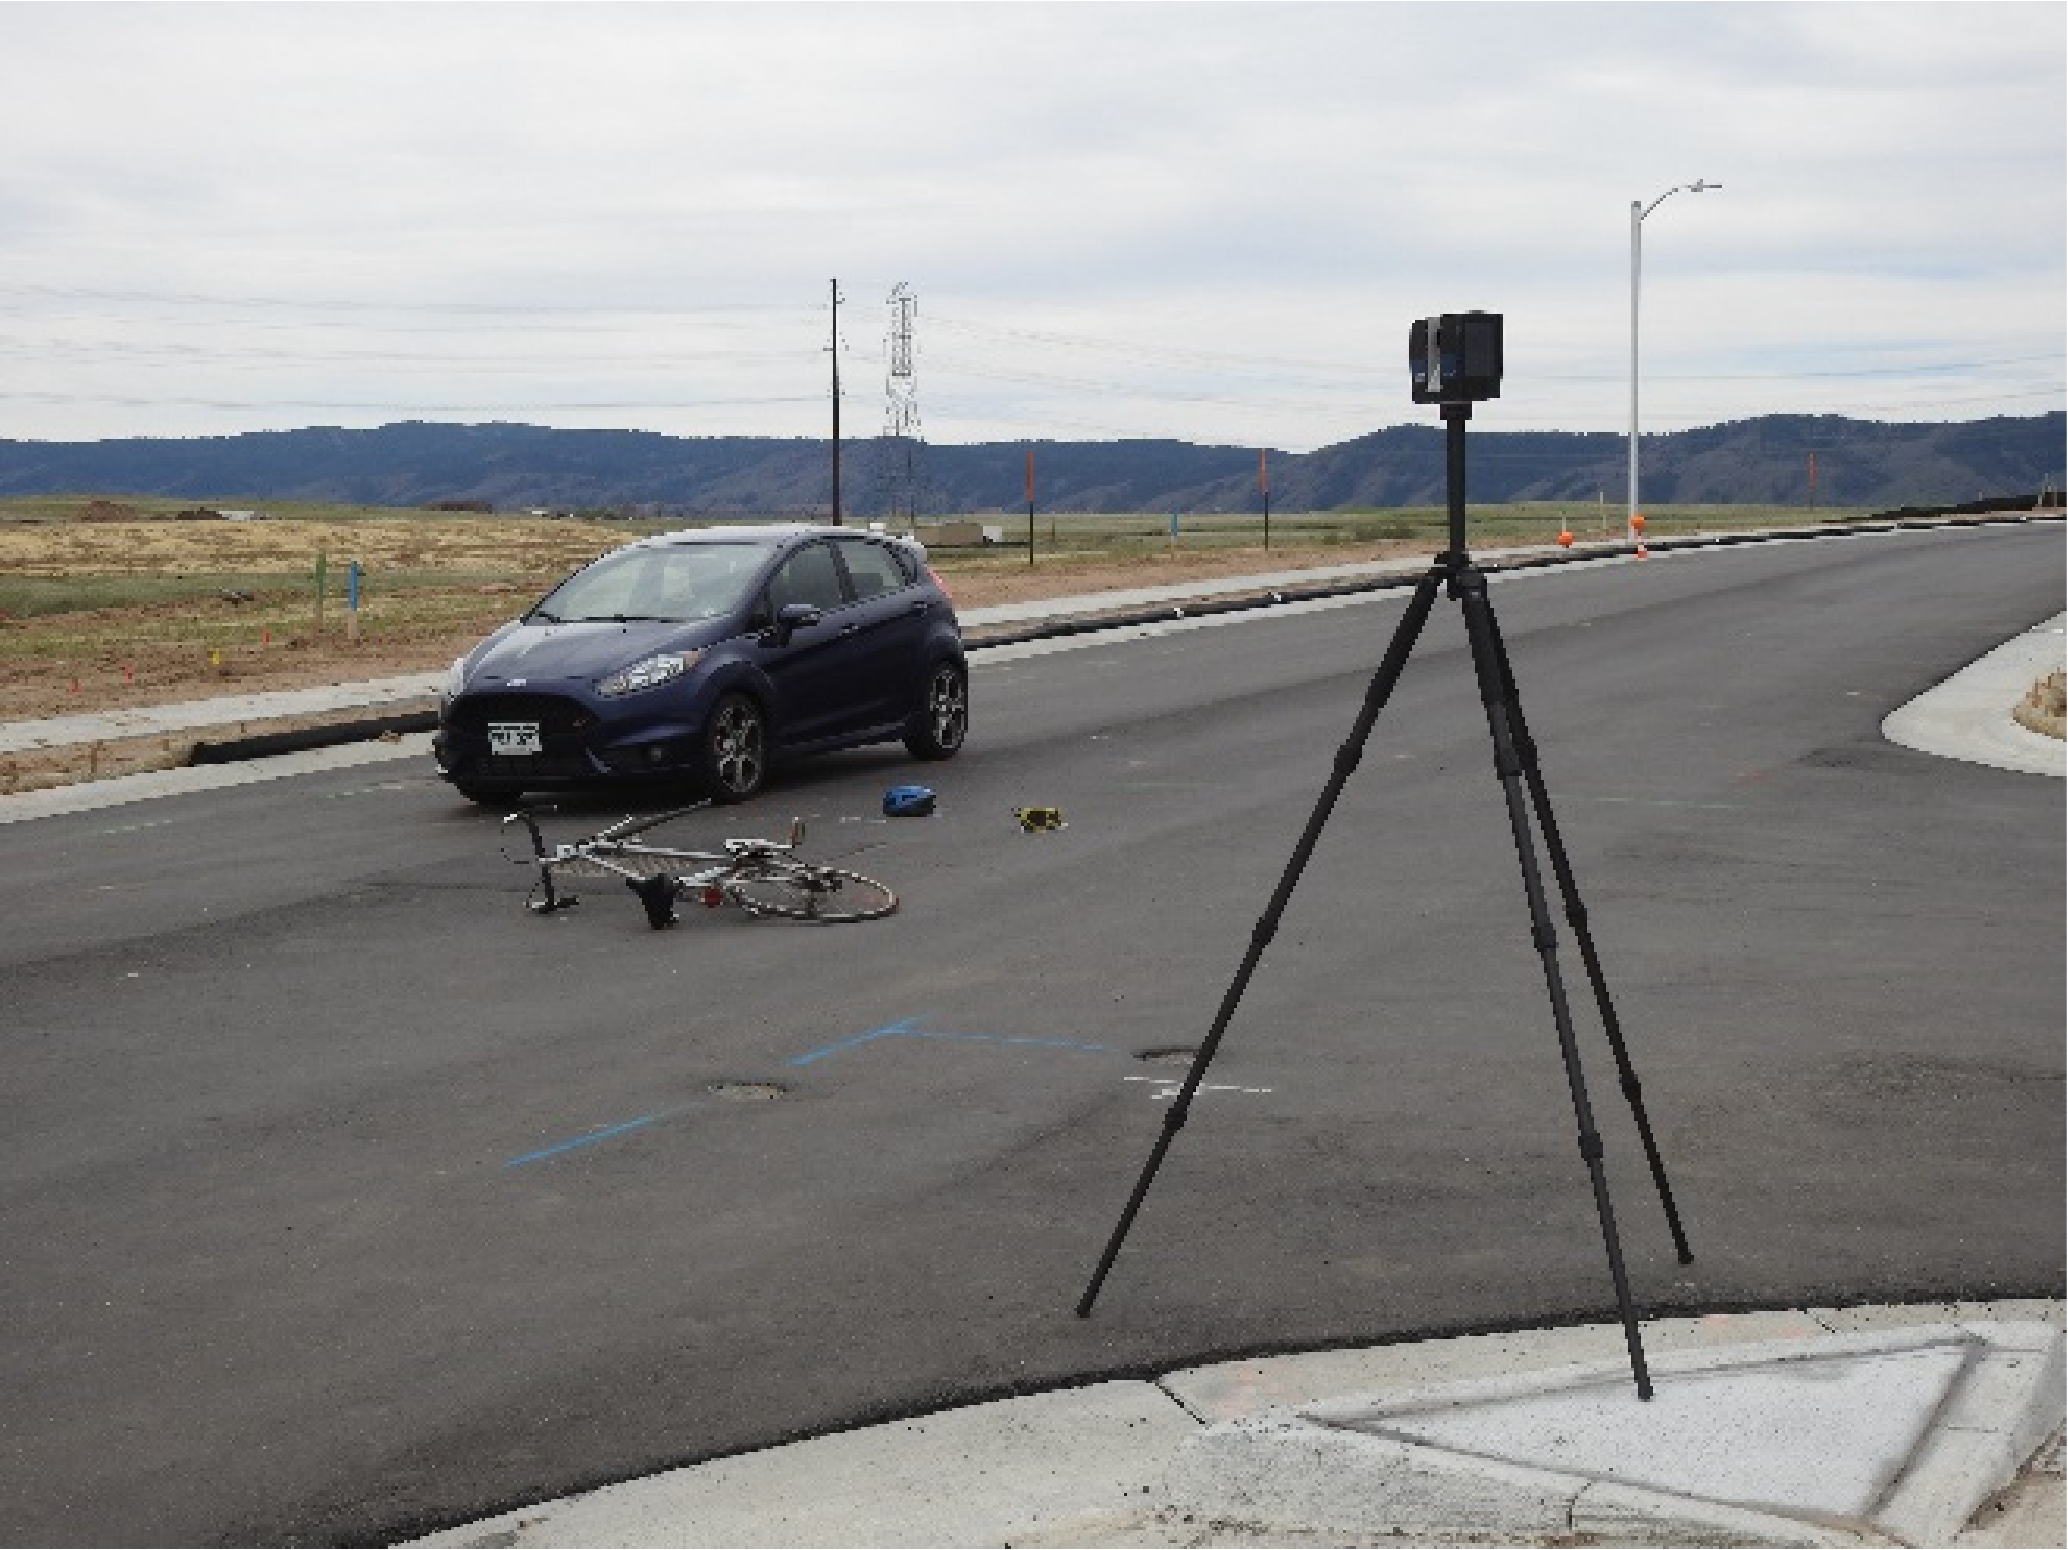
The intent of this exercise by OEC Forensics focused around using the quickest documentation methods that could obtain the most data for each of the three methods. As such, only the necessary points to gather roadway geometry detail and evidence location was completed with the total station survey and digital wheel documentations. Additionally, only three HDS scans of the scene using the FARO FocusS 350 were necessary to capture the roadway geometry and extent of scene evidence. Since the roadway geometry and surrounding area had sufficient detail, no scan targets were used during the HDS survey with the FARO FocusS 350. Ease of registration and increase in point-to-point accuracy across the scan may be achieved using targets, but it is recognized that a law enforcement officer may not always have access to scan targets. Additionally, the intent of using a cloud- to-cloud based registration without targets would serve to potentially increase processing time and overall error, providing a worse-case comparison.

Fig. 5: FARO FocusS first scan location of evidence.

Fig. 6: Total station survey of evidence.

Fig. 7: Wheel baseline documentation of evidence.
Total station documentation required a two- person crew; one to run the total station and record data points, and one to occupy the evidence point with a prism. The total station determined 3-dimensional (x,y,z) points for each location measured, and only a single setup was required to document the roadway geometry and collision evidence.
Due to the horizontal curvature of the roadway, the wheel measurements of the roadway geometry required the use of a 200-foot tape and a 30- foot tape to determine the radius of the main east-west roadway into the scene (chord and mid-ordinate). Wheel documentation utilized the baseline method by establishing the intersecting curb-lines at the northwest corner of the intersection as the north/south and east/west reference point. Each point was measured within the horizontal plane (x,y), but without any vertical measurement due to the capability of the digital wheel. However, grades of the roadway were taken at regular intervals using a smart level, but not with the intention of recreating a 3-dimensional scene from the wheel data given the time constraint objectives.
Measurement Results
The table of Fig. 8 provides the at-scene time to complete each of the measurement techniques for the scenario. The total station survey gathered 68 survey points within 14 minutes but required 4-times greater setup and twice greater tear down times as the HDS scan using the FARO FocusS 350. The three HDS scans required slightly more than twice the amount of time to complete as the total station survey, but gathered nearly 650,000-times more (x,y,z) data points. The maximum allowable relative positional precision for a land survey using the total station is 2 cm + 50 ppm between two surveyed corners, or 0.787 inches.1 The registration report for the three HDS scans using the FARO FocusS 350 indicates a maximum point error less than 13% the acceptable error of a total station survey, with the mean error approximately 8.5% of the acceptable error of a total station survey, as illustrated by Fig. 9. Additionally, the results in Fig. 8 clearly demonstrate that utilizing a digital wheel and 200-foot tape to document the roadway geometry and collision evidence was the least efficient of the three methods presented.

Fig. 9: Scan point statistics of 3-scan point cloud using FARO FocusS 350.
The results contained in Fig. 8 and Fig. 9 demonstrate clear evidence that the FARO FocusS 350 generates vastly more data points in the same relative time as a total station, and at a much higher level of accuracy and precision. The use of a digital wheel and 200-foot tape to record sufficient roadway geometry and evidence for a scaled diagram is not only more time consuming than a total station or FARO FocusS 350, but more susceptible to error due to surface irregularities, the ability of the user to maintain a straight course while measuring, and the skill of the practitioner to make such measurements with perfect perpendicularity to the reference baseline.
Diagramming Results
Creating a scaled diagram with sufficient detail using a CAD program represents an important task for any collision analysis. Using the collected data points, the analyst must either import a survey log into a CAD program, create a point log from the survey data, or import a registered point-cloud from the HDS scans. The choice of which CAD program to use may assist in the ease of importing point logs or HDS scans. For this study, OEC Forensics utilized the FARO Zone 3D2 CAD program for all three scaled diagrams generated for the staged collision event. Using FARO Zone 3D provides a significant advantage when working with HDS point-cloud data created by the FARO FocusS 350 or other FARO Focus scanner products. Individual scans registered using SCENE3 seamlessly and easily import into FARO Zone 3D without additional post-processing or special file format extensions. Coordinate point logs are created from the survey or wheel data using the Coordinate Data Table function found along the top control bar in the Home tab. The Draw/Edit tab allows for the creation of line drawings of the incident location. The Symbols library contains scaled models of various vehicles and objects that may be useful when creating a scaled evidence diagram. When importing an HDS point-cloud created by the FARO FocusS 350 while vehicles and evidence are present on the roadway, there is no need to import additional models to complete the diagram. Using the HDS point- cloud, the analyst imports the registered scans, cleans any extraneous points not eliminated during the registration process and has a complete scaled image ready for immediate analysis.
The table contained in Fig. 10 outlines the time from export of the measured data to the final creation of a usable scaled diagram for analysis using each of the three measurement methods of this study. The total time necessary to create a scaled diagram of the scene suitable for analysis was similar for the total station survey and wheel/tape measurement methods due largely to the necessity to enter the individual points, create line drawings connecting the points and importing scaled models of the vehicle, bicycle and other evidence. However, the overall time to import, process, register and load the HDS point-cloud image of the scene created using the FARO FocusS 350 required a fraction of the total time of the two manual methods.
The scaled diagrams generated by each of the three methods are illustrated by Fig. 11 through Fig. 13. The line drawings created from the total station and wheel/tape survey methods are comparable in general accuracy and definition when identifying the location of tire marks and vehicle rest locations as compared to the HDS point-cloud. However, the 3D roadway geometry detail and precision are lacking in the total station survey, and completely absent in the wheel/tape drawing. For this staged collision, available visibility for the bicycle rider and vehicle driver may be an important factor of an investigation. Only the topographical detail captured by the FARO FocusS 350 scans of the scene provide the detail necessary to assess visibility. Additionally, imperfections on the roadway surface, traffic control devices, locations of sidewalks and drain pans, as well as the actual damage to the vehicle and bicycle are captured with the HDS point-cloud. However, such physical evidence cannot be captured in sufficient detail using the total station or wheel/tape methods without considerably more time spent on-scene by the investigator. Fig. 14 and Fig. 15 show the total station and wheel/tape line drawings, respectively, placed upon the HDS point-cloud scan. Fig. 16 and Fig. 17 illustrate the topographical advantage of an HDS point-cloud for visibility assessment.

Fig. 11: Scaled diagram created by wheel/tape method.

Fig. 12: Scaled diagram created by total station survey.

Fig. 13: Scaled diagram created using FARO FocusS 350 HDS scans.

Fig. 14: Wheel/tape line drawing superimposed upon FARO FocusS 350 HDS scans.

Fig. 15: Total station line drawing superimposed upon FARO FocusS 350 HDS scans.

Fig. 16: Terrestrial view of topography captured by only three FARO FocusS 350 HDS scans.

Fig. 17: Terrestrial view of topography captured by only three FARO FocusS 350 HDS scans.
Findings and Final Thoughts
Safe and timely creation of a scaled diagram for future analysis and consideration comprise the main objectives of scene documentation. Augmenting scene measurements with photographs and video provide additional means of securing perishable physical evidence. However, photographic and video records still require the police or forensic investigator to accurately relate evidence position, dimensions and relationships to the scaled incident scene. If an investigator does not make direct measurement to evidence found in photographs, additional steps may become necessary to place the evidence on the scaled diagram. If the roadway geometry or surface changes between the time of the photographs and the scene visit, the location of the evidence may be lost forever. Measuring roadway evidence can be time consuming, especially for lengthy incident scenes or when multiple vehicles and roadway/ground surfaces are involved. The FARO FocusS 350 allows for a comprehensive and complete documentation of the scene and physical evidence without the need for time- consuming and painstaking single-point collection.
When considering the time to gather the data and create a usable scaled diagram for analysis of the staged scenario, the FARO FocusS 350 required 73.5 minutes, total station survey 88 minutes, and the wheel/tape method 155 minutes. The FARO FocusS 350 captured over 44 million data points in less time than 100 data points could have been captured using a total station or wheel/tape methods, limiting roadway and traffic interruptions. Total station surveys can span large distances but require a two-person crew to do so, and one of the crew members must occupy the measured position within the roadway. A single HDS scan can effectively gather a large density of points over a circular area of up to a 60-meter diameter at each setting. The coverage provided by the FARO FocusS 350 allows a single properly trained investigator with an HDS scanner to stand safely clear of vehicle traffic while gathering crucial data points, all without the need to occupy a position within the traffic-way.
Time savings and safety while gathering points and generating a scaled diagram for analysis are crucial, but not the only metrics by which the three methods should be compared. The overall quality of the deliverable product and its accuracy between points establishes the FARO FocusS 350 as the hands- down winner in this study. While averaging approximately 11 minutes per scan, additional scans of the roadway leading into, as well as the topography surrounding an incident location can be gathered for supplemental analysis, animations and recreations of the scene conditions. An HDS scan using the FARO FocusS 350 or other FARO Focus scanning product can capture ground vegetation, foliage, tree limbs and other potential visibility obstructions with realistic detail that cannot be achieved by any other means. For these reasons and many others of a practical and technical nature, OEC Forensics chooses to document incident scenes, vehicles, and other subjects of forensic interest using one of our many FARO Focus scanners.
About OEC Forensics
For more information on how OEC Forensics utilizes the FARO Focus family of scanners, or practical tips on planning and executing HDS scanning methods for forensic applications4 visit: www.OEC4N6.com
References
1 Minimum Standard Detail Requirements for ATLA/NSPS Land Tile Surveys, Paragraph 3(E)(v) Measurement Standards, American Land Title Association®(ATLA), National Society of Professional Land Surveyors (NSPS), effective February 23, 2016.
2 FARO Zone 3D, version 18.0.0513, ©2018 FARO, Inc., all rights reserved.
3 SCENE version 7.1.1.81, SCENE API version 2.0.17.81, ©2001-2017.
4 Ogden J., “Practical Planning and Execution Procedures for Effective Forensic HDS Scanning”, SPAR International 2014, Forensic and 3D Legal/Court Division, Colorado Springs, Colorado, 2014.